
Transportation Industry UI Design Solutions: Empowering through Visuals to Drive Precise Urban Traffic Management
Driven by the accelerated urbanization process and the deepened construction of intelligent transportation, the complexity and data volume of transportation systems have grown exponentially. Core scenarios such as rail transit, intelligent driving, and GIS map applications have put forward higher requirements for the information carrying capacity, visual expressiveness, and user interaction efficiency of software interfaces. UI design in the transportation industry is no longer a simple "visual packaging", but a core link connecting data insights, user needs, and management decisions. Based on the pain points of digital transformation in the transportation industry, this paper proposes a UI design solution centered on "user-centric, data-core, and innovation-oriented", decodes the value of transportation data through multi-dimensional visualization means, and helps upgrade the refined governance of urban transportation.
I. Straight to Industry Pain Points: Core Bottlenecks of Transportation UI Design
At present, UI design of transportation software generally faces four core problems: "insufficient visual expressiveness, chaotic interaction logic, disconnection between design and business, and difficulty in later reuse", which restrict the full release of software value.
1. Lagging Visual Presentation and Weak Map Expressiveness
Most transportation software adopts general map templates and insufficiently applies the rendering technologies of professional map tools such as ArcGIS and SuperMap, resulting in monotonous map color schemes and outdated visual styles. It fails to intuitively present the hierarchy and relevance of core information such as transportation road networks and population distribution, reducing the efficiency of data interpretation.
2. Ambiguous Interaction Logic and High User Operation Costs
The overall software framework and menu navigation do not conform to the usage habits of transportation industry users, and interaction methods such as map contraction/expansion and information pop-ups lack intuitiveness; the operation process is cumbersome, key functions are hidden deeply, and there is a lack of necessary operation guidance and result feedback mechanisms. As a result, users are prone to confusion in core operations such as passenger flow inquiry and route planning, which greatly reduces work and travel efficiency.
3. Disconnection Between Design and Business, Lack of Industry Recognition
Interface design has problems such as inconsistent styles, cumbersome icons, and chaotic information hierarchy, making it difficult for users to quickly capture key content such as train schedules and station information; page layouts are stereotyped, failing to combine the business characteristics of segmented scenarios such as rail transit and emergency command. The understanding of industry needs is superficial, lacking innovation and personalized expression.
4. Lack of Design Specifications, High Difficulty in Later Reuse
Design outcomes lack standardized specifications, making it difficult to reuse high-quality components and styles in other product lines; visual deviations are prone to occur in multi-resolution adaptation and cross-platform development; the development link is disconnected from design requirements, leading to difficulty in ensuring UI consistency and increasing the cost of later maintenance and iteration.
II. Core Value of the Solution: Experience Upgrade from "Usable" to "Easy to Use"
In response to the above pain points, this solution takes "cost reduction & efficiency improvement, data empowerment, and experience optimization" as the core goals, reconstructs the value of transportation software through systematic UI design, and realizes the landing of four core values.
1. Simplify Operation Processes and Improve Core Efficiency
Reconstruct the product architecture based on user habits, reduce the steps of core operations such as ticketing, inquiry, and scheduling through reasonable function division, convenient navigation design, and intelligent recommendation systems. For example, in the train monitoring system, frequently used functions such as "light warning" and "passenger flow statistics" are front-placed, combined with clear operation guidance, allowing users to complete tasks quickly and reduce time costs.
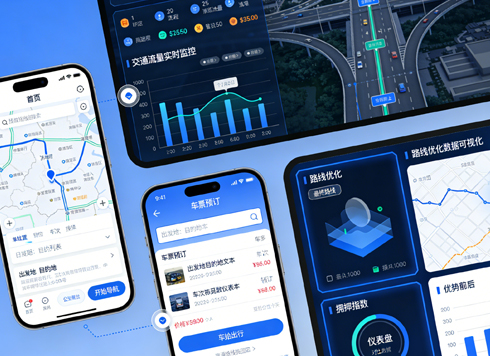
2. Strengthen Data Insights to Support Scientific Decision-Making
Use visualization means such as flow line charts, road network charts, and dynamic dashboards to convert complex data such as transportation population distribution, time-sharing passenger flow changes, and road network congestion index into intuitive visual language. Through hierarchical and multi-form data presentation, help managers quickly grasp the transportation situation and provide accurate basis for decisions such as line optimization and capacity allocation.
3. Optimize Visual Experience and Enhance User Stickiness
Unify the interface design style, clarify the visual hierarchy of information, and improve the aesthetics and usability of the interface through high-quality color schemes, concise icon design, and smooth dynamic transitions. For GIS map scenarios, deeply integrate map rendering with interface style, ensuring both clear presentation of professional data and compliance with modern user aesthetic needs, greatly improving user satisfaction and loyalty.
4. Establish a Standard System to Reduce Reuse Costs
Formulate unified UI design specifications and component development standards, clarify the styles and interaction rules of controls such as buttons, Tab tabs, and charts, to ensure that design outcomes can be quickly reused in different product lines. At the same time, provide multi-resolution adaptation solutions to ensure visual consistency across multiple terminals such as train monitoring screens, mobile APPs, and command center large screens, facilitating later maintenance and iteration.
III. Core Highlights of the Solution: Differentiated Advantages Empowered by Technology and Experience
Relying on more than ten years of design experience in the transportation industry and in-depth application of professional tools such as ArcGIS and Amap, this solution forms four differentiated highlights: "full-process design, data visualization, intelligent innovation, and full-link landing", providing more competitive UI solutions for the transportation industry.
1. Ten Years of Accumulation: Full-Process Interaction Design System
Based on more than ten years of industry practice, a complete service process from user research to prototype landing has been built. Through industry characteristic interviews and user demand mining, reorganize the product architecture and interaction rules to form interaction specifications in line with transportation scenarios. For example, in the design of emergency command systems, redundant operation pages are merged and task processes are optimized, increasing emergency response efficiency by more than 30%; at the same time, output full-process interaction prototypes to ensure that design concepts are highly consistent with business needs.
2. Data Visualization: Accurate Presentation of Key Situations
Focus on core transportation data and build an integrated visual presentation system of "monitoring - analysis - early warning". In safety situation monitoring, intuitively display the distribution and level of safety risks through color contrast and dynamic identification; in traffic road condition monitoring, comprehensively present travel volume, population sources, and time-sharing passenger flow changes by combining flow line charts with charts on both sides, helping managers accurately grasp regional traffic situations. For example, in public security emergency software, meteorological and road condition data are converted into visual charts to provide intuitive support for route planning and disaster relief strategies.
3. Intelligent Innovation: Reshape Driving and Interaction Experience
Following the development trend of autonomous driving and intelligent cockpits, integrate cutting-edge technologies such as HUD, AR-HUD, and virtual digital humans into UI design. In automotive HMI interfaces, clearly present core information such as vehicle speed, fuel volume, and navigation, and add intelligent emotional interaction functions that can adjust interface styles and information push methods according to the driver's state; in the rail transit field, use AE to design micro-animations of EMU entering stations, enhance scene immersion, and improve the temperature of user experience.
4. Full-Link Landing: Full-Process Guarantee from Design to Development
Provide "visual design - development landing - testing and maintenance" full-link services to ensure the accurate landing of design outcomes. In the CRRC train monitoring screen development project, based on languages such as Fltk, Codesys, and QT, develop 6 sets of software containing controls such as lists, bar charts, and dashboards, unifying interface styles and development standards; in the cooperation project with Hollysys, optimize the operation experience through dynamic effect design, which has been highly recognized by customers. At the same time, provide landing inspection and later maintenance services to ensure the long-term stable operation of the software.
5. Standard Leadership: Componentization and Standardization Support
Establish a complete UI component library and design specifications, covering various controls such as buttons, warning buttons, and charts, clarifying styles, interaction logic, and development standards. The specifications can be directly applied to the development of multiple product lines to solve the problem of design reuse; at the same time, in multi-resolution adaptation, ensure that the interface maintains good visual effects and operation experience on different terminals through adaptive layout design.
IV. Conclusion: Taking UI Design as the Fulcrum to Unleash New Value of Transportation Governance
The refined governance of the transportation industry is inseparable from the decoding of data value and response to user needs by UI design. With "solving pain points and creating value" as the core, this solution transforms UI design into a core driving force for improving transportation operation efficiency, optimizing management decisions, and enhancing user experience through professional interaction design, accurate data visualization, innovative technology application, and full-link service guarantee. In the future, we will continue to deepen our roots in the transportation industry, keep up with the trend of intelligent development, continuously iterate design concepts and technical means, provide more innovative and practical UI design solutions for the digital transformation of the transportation industry, and help build a more efficient, intelligent, and humanized modern transportation system.